
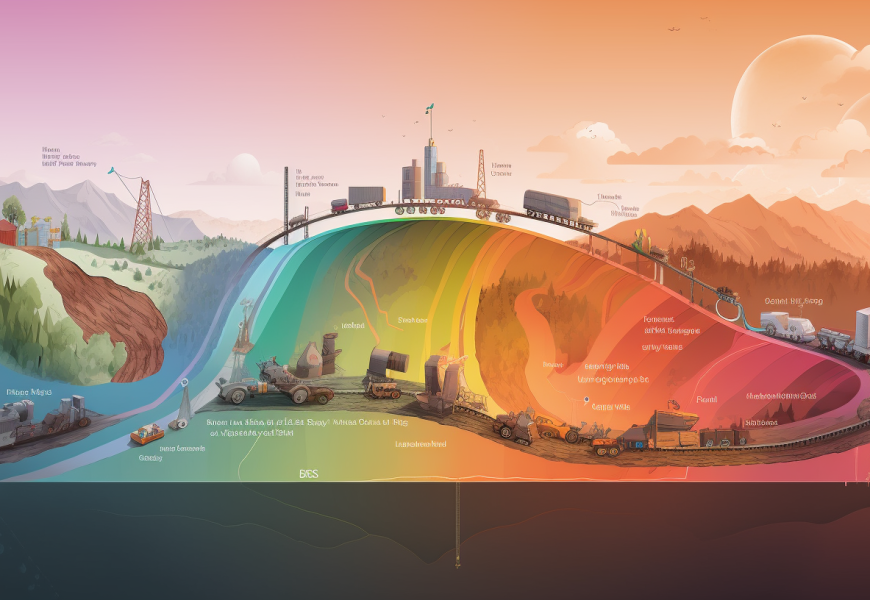
The Lassonde Curve: A Roadmap for Mining Investors
In the high-stakes world of mineral exploration, understanding market psychology is just as important as geology. For investors and industry professionals, the Lassonde Curve—named after mining legend Pierre Lassonde—is the definitive framework for navigating this volatility.
The curve illustrates the typical life cycle of a junior mining company, charting the dramatic rise and fall of share prices as a project moves from a rough concept to a producing mine. By mastering this cycle, investors can identify where value is created, where the hype fades, and where the best entry points lie.
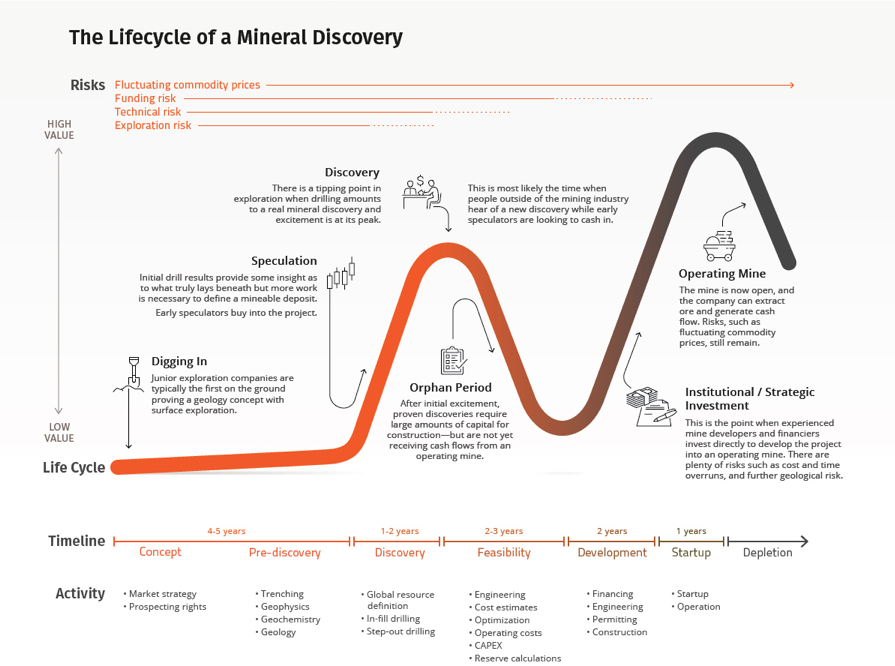
The 5 Stages of the Lassonde Curve
The Lassonde Curve visualizes the journey of a mineral property through five distinct phases. Each phase carries a different risk profile and potential for return.
1. Concept Phase
The journey begins in the Concept Phase. This initial stage carries the highest risk and the lowest valuation. At this point, there is no mine and often no drilling. Geologists are simply developing theories about potential mineral deposits based on preliminary data, historical maps, and surface sampling.
For the investor, this is a gamble. You are betting on a geological theory rather than a proven asset. Because the odds of finding a mine are statistically low, the share price is usually stagnant and very cheap.
2. Discovery Phase
As exploration progresses and diamond drills start turning, the Discovery Phase begins. If promising results emerge—such as a drill core showing high-grade gold or copper—speculative interest explodes.
This phase is characterized by a violent spike in perceived value. Traders and speculators rush into the stock, driven by the potential size of the deposit. This is often the point of maximum hype, where the share price creates a vertical peak on the chart. Investors who bought during the Concept phase can see massive returns here, but buying new shares at the top of this peak is dangerous.
3. Feasibility Phase (The “Orphan Period”)
Following the initial discovery, the project enters a period of detailed analysis known as Feasibility Studies. This is the most critical and misunderstood phase of the curve. The excitement wanes as the company stops releasing flashy drill results and starts the boring, expensive work of engineering, environmental permitting, and economic modeling.
As the complex realities of mine development set in, the “hot money” speculators get bored and sell their shares. This leads to a significant dip in perceived value, often called the “Orphan Period.” The stock price can drift lower for years, even though the project is technically advancing. For the savvy, long-term investor, this dip often represents the best risk-to-reward entry point.
4. Development Phase
Once the studies are complete and financing is secured, the project moves into Development and Construction. The company transitions from an explorer to a builder.
As the mine gets built, the risk of failure decreases significantly. Investors can see physical progress—road building, shaft sinking, and equipment arrival. Consequently, the perceived value typically begins to rise again. This is usually a steady, sustained climb toward the project’s fair value, distinct from the manic spike seen during the Discovery phase.
5. Startup & Production
The final stage represents the realization of the project’s potential: Production. The mine becomes operational, and the company transitions from spending money to making money.
At this stage, value generally reaches its peak. The company undergoes a “re-rate,” where institutional investors (like pension funds) who avoid exploration risk are finally able to buy the stock. The company is no longer valued on speculative dreams, but on earnings, cash flow, and dividends.
Applying the Lassonde Curve
The Lassonde Curve serves as a guide for investors interested in early-stage opportunities in the mining sector, particularly with junior mining companies focused on exploration and development. By understanding the stages of the curve, investors can assess the progress and potential value creation of a mining project.
Investors can analyze a company’s milestones and compare them to the expected progression on the Lassonde Curve. This assessment helps them gauge the project’s stage and the potential impact on its intrinsic value. For example, a positive feasibility study announcement can act as a catalyst for share price movement, indicating a significant step towards development.
It’s important to note that the Lassonde Curve is not the sole determinant of a project’s success or an investor’s decision-making process. External factors, such as market conditions, commodity prices, regulatory hurdles, and operational challenges, can influence a project’s outcomes.
Case Study: The Oyu Tolgoi Deposit
The Oyu Tolgoi copper-gold discovery in Mongolia provides a real-life illustration of the value cycle in action. From the initial concept and exploration stages to feasibility, development, and production, this case study exemplifies the complex journey of a mining project.
By studying the Oyu Tolgoi example, investors and industry professionals can gain valuable insights into the dynamics of mineral discoveries, assess their investment potential, and navigate the inherent risks.
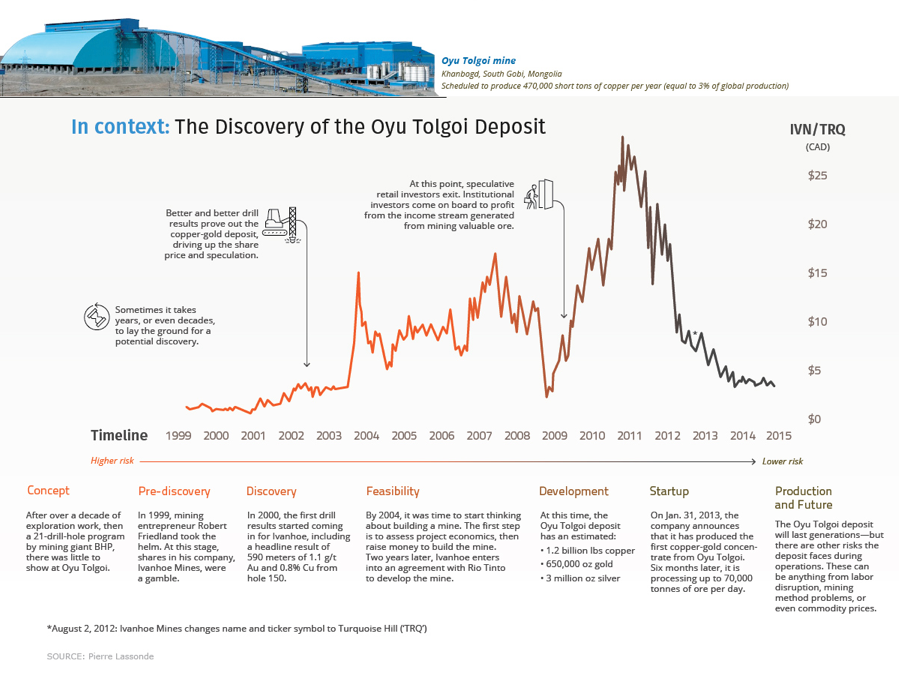
Phase 1: Concept (15+ Years)
Exploration around Oyu Tolgoi began in the 1980s, but little meaningful progress was made. In 1996, BHP completed 21 drill holes before losing interest and optioning the ground to Robert Friedland’s Ivanhoe Mines—a penny stock at the time and considered a highly speculative bet.
Phase 2: Discovery (Approx. 3 Years)
Everything changed when Ivanhoe drilled the legendary “Hole 150,” which returned an extraordinary 508 meters of high-grade copper and gold. To visualize it, imagine a 45-story building where one-third of every floor is made of copper. This single intercept ignited a frenzy of speculation, pushing the company into the classic “Discovery” phase as the market recognized the potential scale of the deposit.
Phase 3: Feasibility/Orphan Period (Approx. 2 Years)
After the excitement, the hard work began. Ivanhoe had to demonstrate economic viability through early engineering studies, starting with a scoping study in 2004. The market cooled during this period, waiting for confirmation that the deposit could become a mine. Volatility persisted until Rio Tinto stepped in as a strategic partner, finally solidifying the path to development.
Phase 4: Development (7 Years)
Between 2006 and 2013, Oyu Tolgoi transformed from a discovery into a construction powerhouse. Shafts were sunk to depths of over 1,300 feet, and extensive infrastructure took shape. Resource estimates ballooned to 1.2 billion pounds of copper and 650,000 ounces of gold. This period required enormous capital investment and tested investor patience—even as Mongolia’s economy surged from the project’s activity.
Phase 5: Production (2013 – Present)
In January 2013, Oyu Tolgoi produced its first copper-gold concentrate, officially entering the production phase. The mine now processes roughly 70,000 tonnes of ore per day. Investor focus has shifted from speculation about what might be in the ground to evaluating operational performance, cost efficiency, and leverage to commodity prices.
Strategic Takeaways for Investors
The Lassonde Curve is not a guarantee, but it is a powerful orientation tool.
- Identify the Stage: Before buying, ask: Is this company in the hype of discovery, or the boredom of the Orphan Period?
- Timing the Orphan Period: The most contrarian gains are often made by buying good projects when they are “boring”, during the feasibility phase when speculators have left but the gold is still in the ground.
- Catalysts Matter: In the Development phase, look for specific catalysts (permits, financing announcements) to signal the start of the secondary uptrend.
- Know the Risks: The Curve assumes the mine gets built. In reality, many projects fail during the Orphan Period due to lack of funding, political issues, or fatal engineering flaws.
Conclusion
The Lassonde Curve acts as a roadmap for the chaotic journey of mineral discovery. By recognizing these cycles, specifically the manic peaks of discovery and the depressive troughs of feasibility, investors can make rational decisions in an irrational market, positioning themselves for value creation rather than chasing hype.